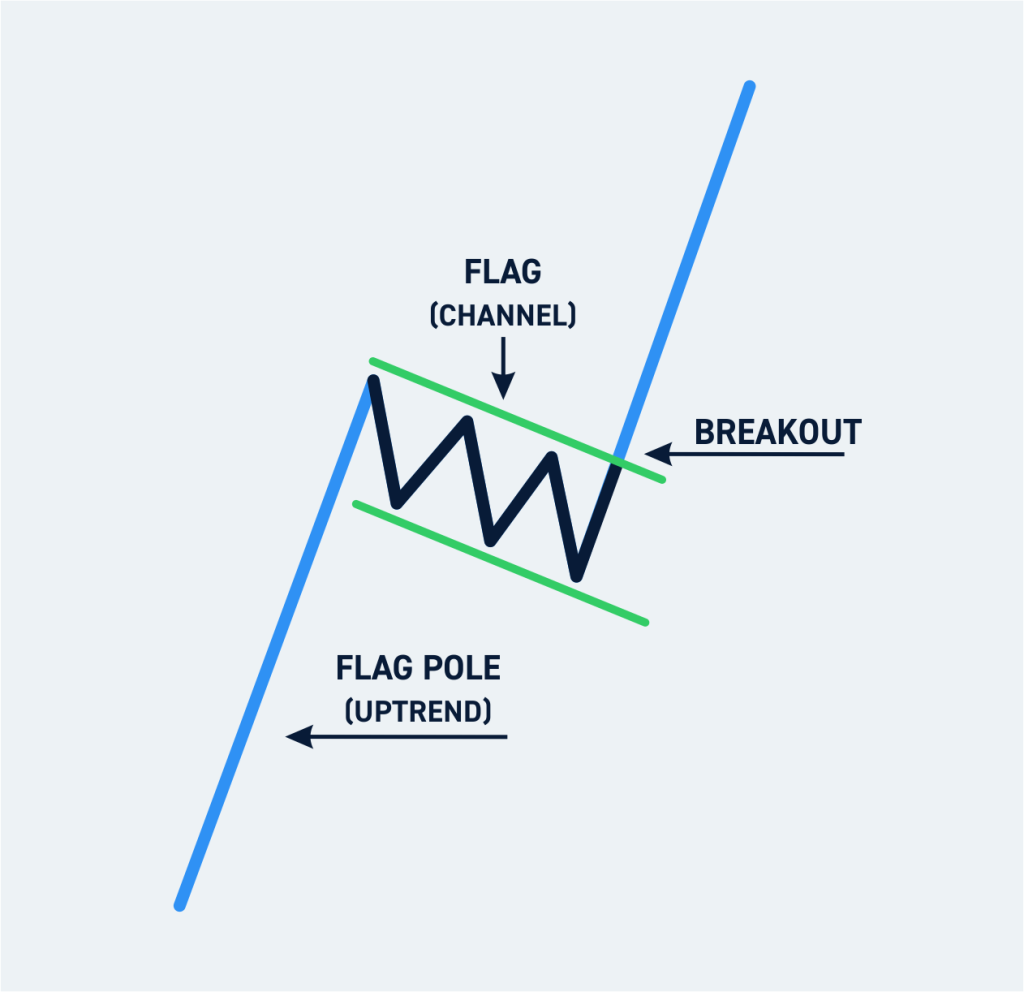
Our favorite pattern to trade for short to medium term is called a bull flag. Bull flags have a high likelihood of playing out favorably, but the trick is spotting them early in the pole formation or during the flag channel/triangle.
How Technical Analysis Helps Investors
We would like to start out this article by mentioning that we are not professional technical analysts. We are researchers and data analysts who specialize in fundamental analysis, trend catching, and swing trading based on narratives. We do, however, trade stock options using basic TA. Technical analysis is helpful for all traders and investors. TA is essentially psychology that you can see.
The history of TA comes from the 18th century and a famous rice merchant. He was able to analyze rice price data over time, thus forming the candlestick patterns we see today [1]. Through analyzing different shapes and patterns Charles Dow, a journalist was able to expand on this theory. Over time many analysts were able to compile enough data to explore several different trading patterns that are likely to play out time and time again.
Long-term investors can use TA to search for likely macro bottoms to dollar-cost-average into. While swing traders such as Moc and I use it to capitalize on medium term movements. We like to use a combination of long- and medium-term investments/trading for our overall portfolio. Bull flags are a particular pattern that generally has around a 65-70% likelihood of playing out.
Bull Flags
While there are better percentage accuracy formations than bull flags, we believe they are one of the easier patterns to point out. Every chart can be viewed by ten people with ten different conclusions, this is part of why jumping into charting yourself can be very beneficial. While we have taught ourselves how to identify and trade bull flags, we tend to cover our options contacts with spot value for most stocks.
Covered calls are when you own spot, and also buy calls (predicting price going upward) on the same asset. For an article on calls and puts, check it out [here]. We tend to stick with stocks that we would also hold long term. Here is an advanced strategy we use to build a portion of our portfolio. Below is a chart we have been charting for months on Bitcoin.
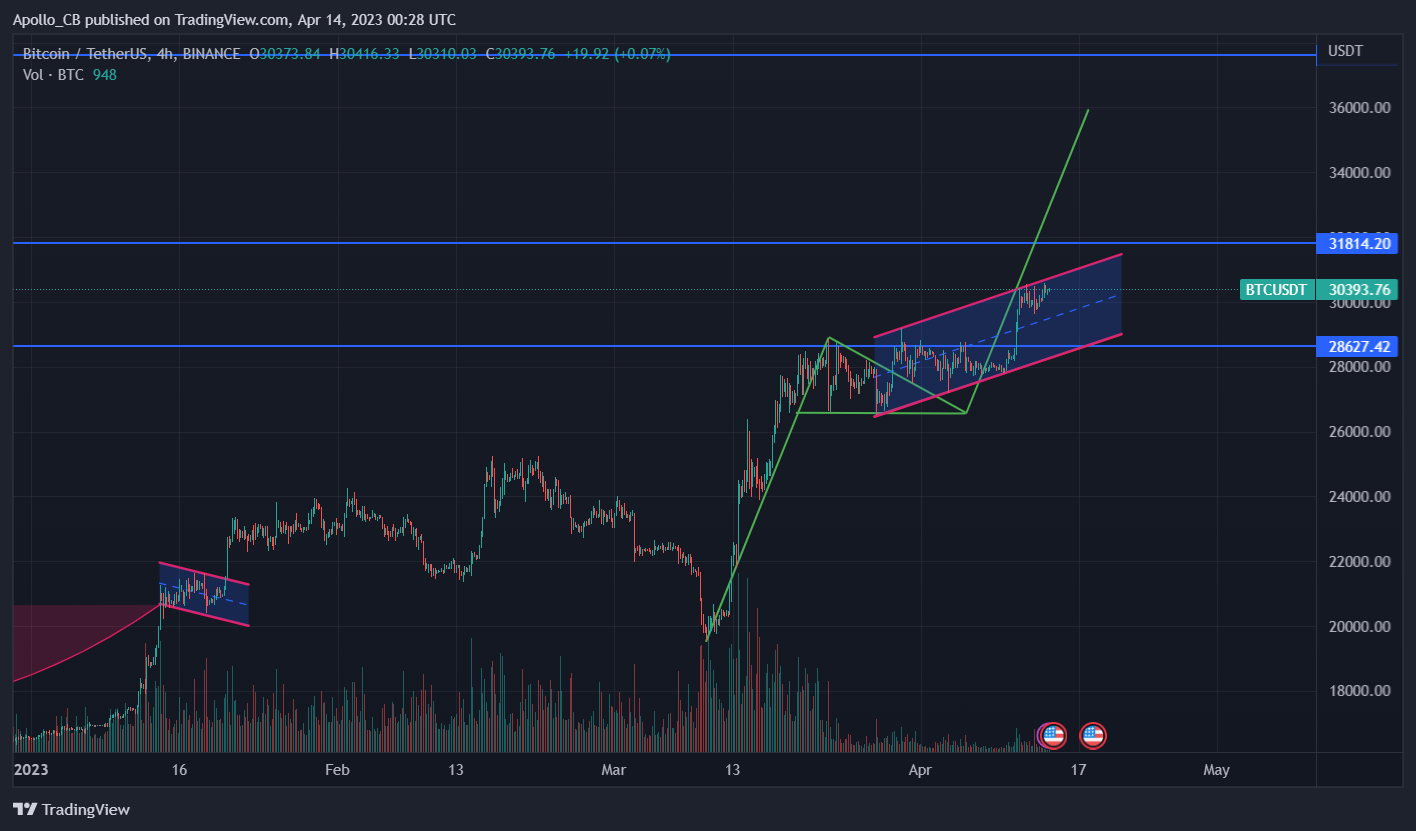
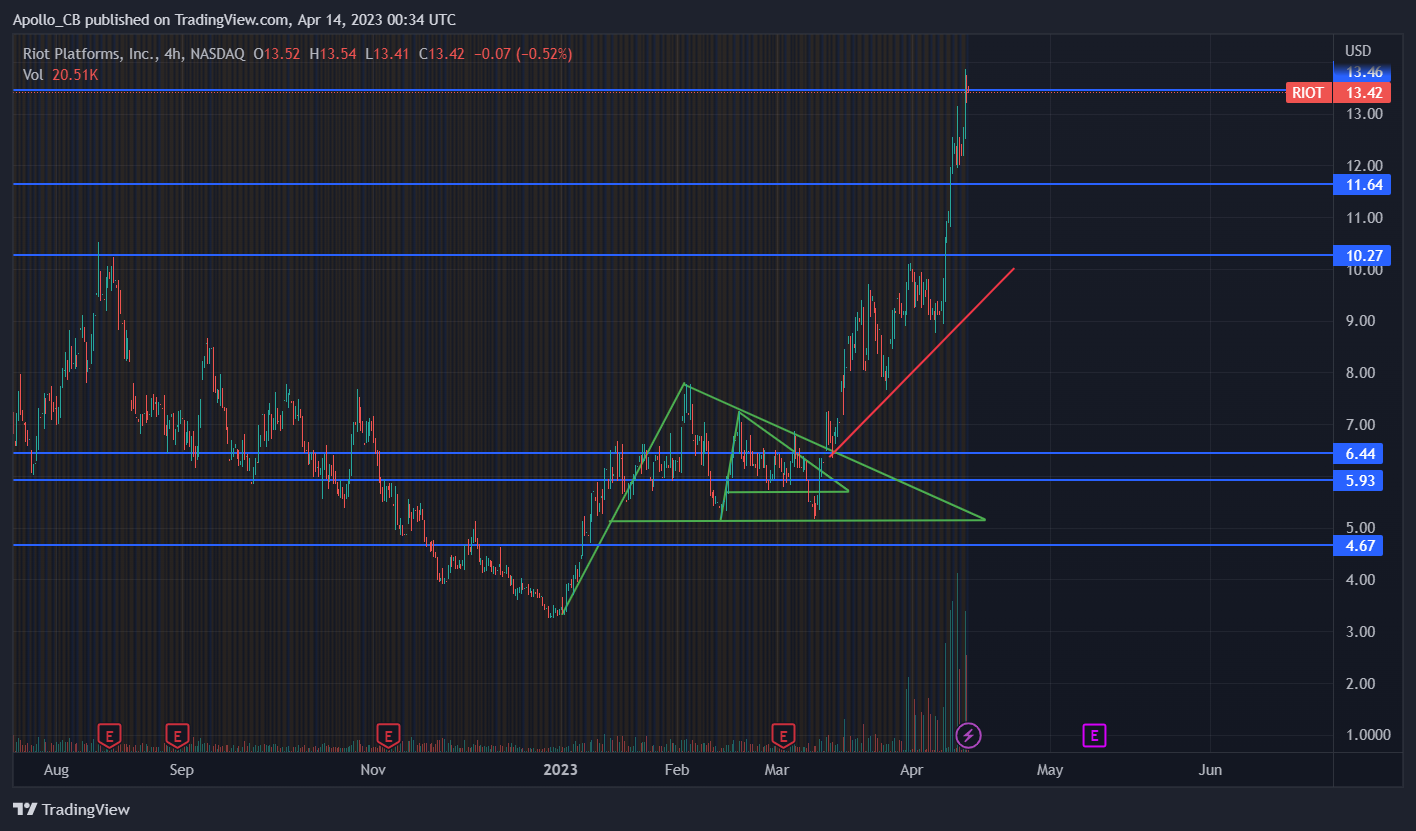
We try to average into our spot position during the likely macro bottom during bear markets. This area was most likely between 15.5k and 20.5k Bitcoin. During this time, we averaged into Bitcoin miner stocks, specifically RIOT and MARA. For an older article on Marathon Digital, check it out [MARA]. Now look at this RIOT chart, look familiar? Riot trends with Bitcoin for the most part.
In this example, we like to use triangles instead of obvious flag shapes. We do this when price action likes to bounce on the same horizontal line. Remember, flags need to descend downward after a bullish leg upward. In this example we drew two time-based flags, one for the larger setup, and then a flag within a flag for a smaller setup. In this case we averaged into the flag at its base of around 5$.
Triangles are helpful because they give you a time limit on the flag, if the position does not resolve to the upside before the triangle space runs out, we exit the trade unless there is a trend line to follow.
Potential Flag on Intel
Potential Flag on Intel
Now let’s look at a live example we might buy naked calls on. Naked calls are when you do not own spot of the asset you are thinking about getting into. MoC brought this one to my attention tonight, this trade looks fairly reasonable. We just had a strong long term double bottom, which tends to have one of the highest percentages of a resolution.
I like to draw my flags in green, my diagonal trend lines in red, and horizontal areas of interest in blue. Since this flag is intersected by a blue line of interest, we are looking for the flag to break out before April 17th which is the intersection of our red line, blue line, and potential bull flag. IF this does not play out we have an opportunity to average in until about the end of April when the flag ends. We would exit this trade if the blue line support is completely lost.
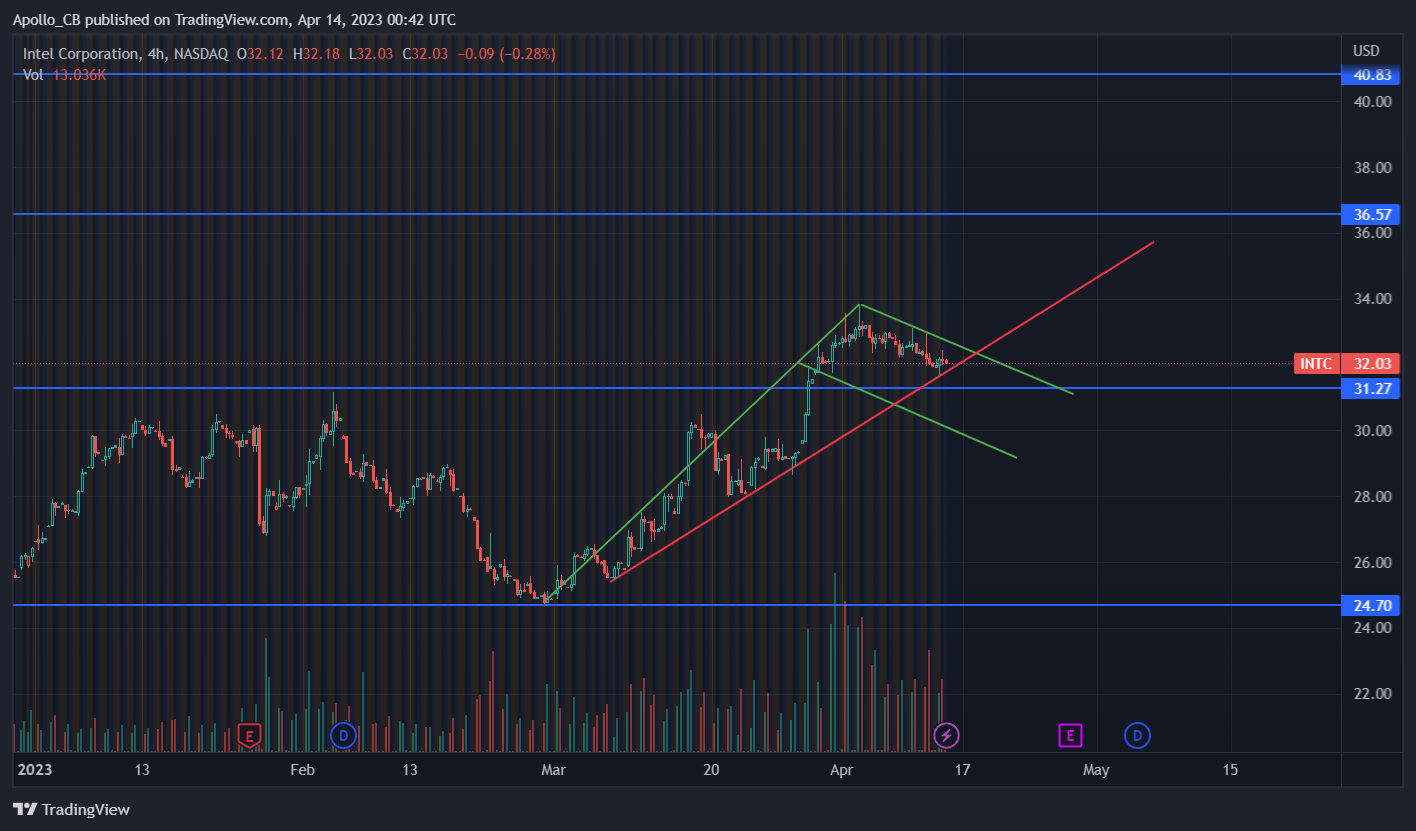
To predict a possible price target simply copy paste the pole, and place it where the price action breaks out from the flag formation, this breakout must pass the green line, and confirm on the daily chart for our strategy. Our first price target is the next blue line, or around 36.50$. If the flag breaks out soon, a higher price target of 41ish dollars is expected, followed by our most bullish price of 45$.
Since Intel is a fundamentally strong stock that carries amazing revenue, high interest, and is held in retirement based mutual funds, this is a fairly safe bet. This is especially true if the calls are covered with some long-term spot stock. The next step is to decide the date of the option, and the strike price. Since we want moderate risk, 30-60 days out is a good starting point. We typically stay around 20, or at most 30% away from the current stock price for our strike price.
The second most important thing to do is to only buy options that have some volume, if you are way out of the money you will likely not be able to sell your options even if the stock price rips. So we come to a conclusion of between 38-40$ strike price. Remember the stock does not need to reach these levels for a lot of money to be made. My preferred setup would be May 19th, which is 36 days out, with a strike of 40$. I like this setup because its at least 30 days out incase my timing is a bit off.
Also the 40$ level is a nice psychological round number that is appealing to the eyes. Believe it or not psychological price levels can be important. 40$ is also not too far in our blue line levels away from the flag, and if we reach 40, the calls would be worth a massive amount by Mid May.
Please remember none of this is financial advice, I am currently not in this position but eyeing it as the chart unfolds. Stay safe out there!


