This short series is aimed at those wishing to graduate from buying and selling digital assets based purely on the liking of a project and whether it ‘feels‘ cheap or expensive. That is how I started, sometimes with the benefit of a vague line chart showing a few days of price action but generally without any idea of the bigger picture. That was a few years ago now, and in this series I‘ll aim to pass on some of the key points I‘ve found along the way to help you get a better insight into how this moves.
Technical Analysis & Charts
Firstly, that app you have been using is probably not giving you any real information about price. It tells you the current price, sure, but not the trend or levels, which is a recipe for FOMO. If the price starts going up, you are likely to panic thinking you missed the train, and if it goes down, you are likely to panic trying to get in while it is “cheap“. This article is for those who are looking to take a more strategic and advanced approach to their entries.
(For an intro article about how to learn when to buy check out MoC’s article [here])
The answer to this is using charts. Whilst something like Coingecko.com can be useful for a quick check of price history (both with a good historical price chart and easy-to-find data on previous highs and lows), we want something we can draw lines on. I recommend getting familiar with Tradingview.com as early as possible; the free version allows plenty of features and many exchanges use Trading View (TV) for their trading interface. Get to TV and find an asset you are interested in, preferably on a large exchange (such as Coinbase or Binance), and set the chart style to Line. We‘ll discuss candles in the next part of the series, but for now, a simple line chart will do.
(TV has charts on almost all assets on exchanges, but if you are looking for on-chain assets not yet listed then Dexscreener.com is a nice site which works similarly to TV)
Technical Analysis & Key Levels
This is the most fundamental thing to be aware of in TA. When you read analysis on various assets, they will often mention the key levels that will dictate price action. Perhaps they need to hold one to start heading back up, or due to losing one, they will likely head down. It‘s easy to get carried away with indicators and trend lines, but just knowing how to spot these levels alone will massively improve your decision-making.
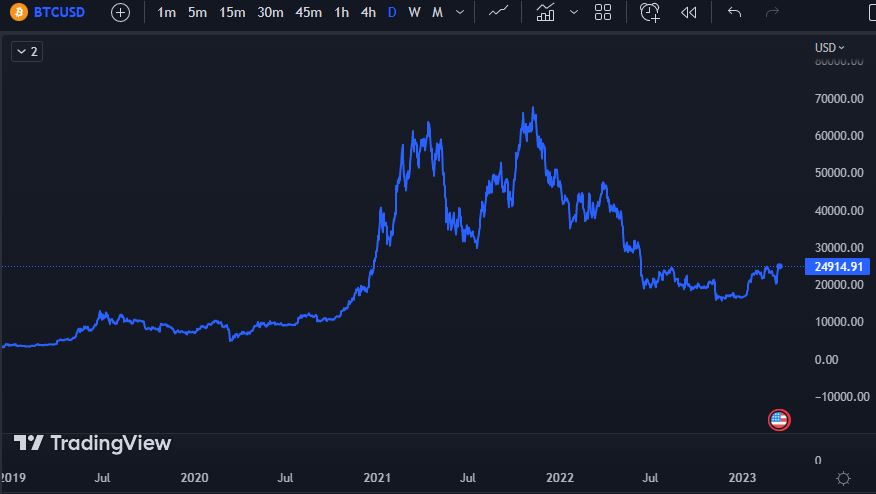
In TV, use the daily timeframe and zoom out to include as much price history as possible.
Even with just the line chart you will be able to see a few useful things.
- Previous peaks (peak prices in the previous bull/hype periods)
- Previous floor prices (prices held even during extended bear periods)
- Levels where the price ‘bounced‘ or pivoted, either from above or below. The more bounces a certain price has, the more important it is.
You will notice there is often overlap between these categories; the price may bounce around the level of a previous peak, for instance. This is expected, and is why such levels are vital to understand.
Go to ‘Trend Line Tools‘, select ‘Horizontal Line‘, and then click somewhere on the chart to spawn a line. You can then drag it up or down until it sits on a level that strikes you as important, and continue doing this with more lines until all key levels are marked. As this uses the daily timeframe, it is also worth seeing which lines seem most important on the weekly (you can change their color if it helps). As a general rule, the lower the timeframe is (1h, 4h etc), the less relevant the identified levels become – especially for swing traders and investors [1].
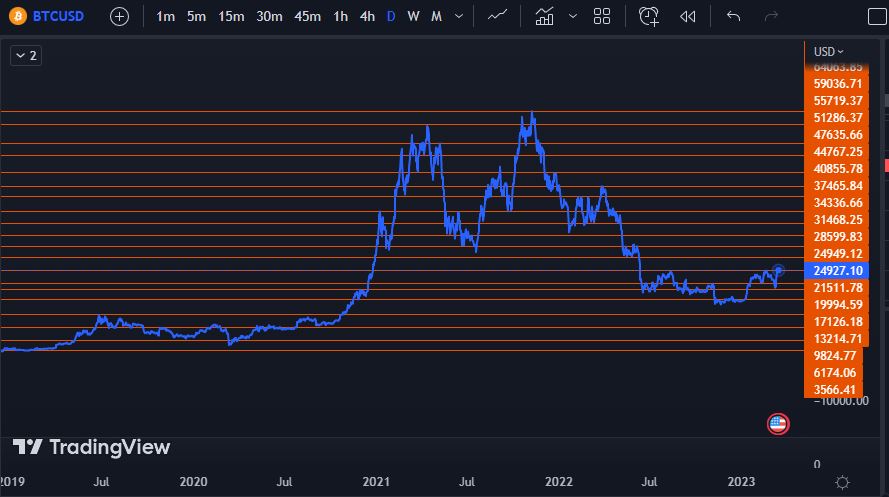
Here is a worked example with BTC (Coinbase). As you can see, the current price (at the time of the screenshot) is a key resistance to overcome.
The above pictures look upsettingly full of lines, I admit, but once you zoom in to smaller price ranges you can see how they help to explain price movements. The following picture shows the wild price action from the first few months of 2023.
Do you notice anything about how the price behaves around the lines?
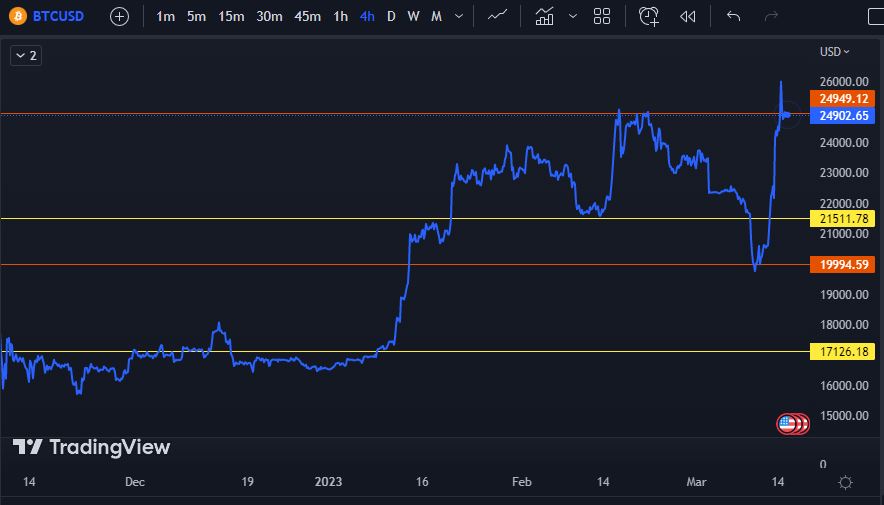
In simple terms, a line overhead shows a place where people are likely to sell – which presents resistance (to price), whilst a line underneath shows where people are likely to buy – which gives support (to price). Such levels become powerful self-fulfilling prophecies and are a must-know to minimise your risk and maximise your profit.
It is not a good idea to buy anywhere under resistance, for instance. You want to see the price move through the line and “flip“ the resistance to support. This does not simply mean going past the line, but either blasting through with a lot of volume or having a convincing retest (coming back to the line, and being supported by buyers). If this doesn’t happen, that price may reject and head back down. Therefore, a good place to sell (some of) your bag after a decent pump is under one of these key resistance levels [2].
Technical Analysis & Resistance
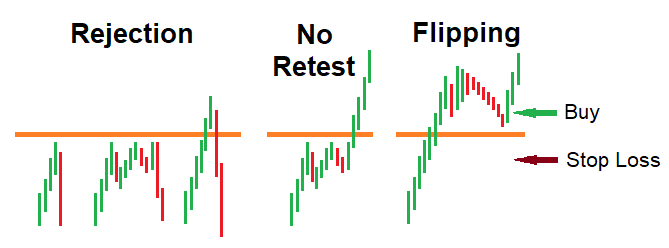
Other uses for these are for setting stop losses. Once something loses its support, it usually heads down to the next support further down. A common strategy is to buy above support, but have a stop loss below the support. (Do be aware that this is common enough that ‘stop hunts‘ are often carried out when the price is near support, but this is still a good option for in-profit stop losses).
These levels are also great for setting ‘set-and-forget‘ limit orders where you are trying to ‘catch a wick‘ in extreme conditions. Imagine that during an alien invasion, or CPI prints a nasty 10% inflation rate, the market absolutely nukes, and prices for your favorite assets are briefly at a huge discount. The problem is that these sell-offs are usually over within minutes, and most exchanges and networks all but stop working during them.
The only way to take advantage of them is to have ‘stink bids‘ already set up. Whilst remembering to never set limit orders directly on a line (always a bit over them to help ensure that they will get filled), a great place to put them is on key levels far below the current price. Likewise with selling, sometimes a saucy picture of the founder is released and suddenly a fully irrational pump springs out of the ether. Having optimistic sell orders set up will help take advantage of such moves, and the best place to put them is… a little under key levels.
That‘s all for key levels. In future articles in this series we will cover the basics of
candlestick price charts, price patterns, trend lines, various popular indicators and more!


