“Bitcoin Dominance” is the weight, in percentage, that Bitcoin (BTC) holds relative to the total market cap of all crypto assets combined.
Bitcoin Dominance Explained
Early in the adoption of Bitcoin, the total weight of Bitcoin was generally in the high 90’s. Over time, as Ethereum (ETH) and other alternative crypto assets grew and adoption increased, they began taking up a larger percentage. Only recently Ethereum was added as its own category to make it easily identifiable without needing to do the math independently.
Depending on the chart or graph you look at, some sites will place all “alt coins”, which is a term used to describe all other coins that aren’t Bitcoin, Ethereum, or stable coins, into one category.
Bitcoin dominance is an important indicator to consider because historically Bitcoin has been the first mover in the market when carrying us into a bullish cycle. While the entire cryptocurrency market has grown tremendously in recent years, Bitcoin still has the capability to move the market all on its own.
In May of 2021, Elon Musk almost single handedly crashed the crypto market – his comments regarding Bitcoin and Tesla’s sale of it lead to a historic crash of Bitcoin’s value. After his comments, which were aimed only at Bitcoin, the entire crypto market plummeted. Bitcoin fell over $20,000 per coin in about a week. As a result, nearly the entire market fell with it. During bull cycles different coins can de-couple from Bitcoin for periods of time. In bear cycles, particularly when Bitcoin is falling, nothing can hide [1].
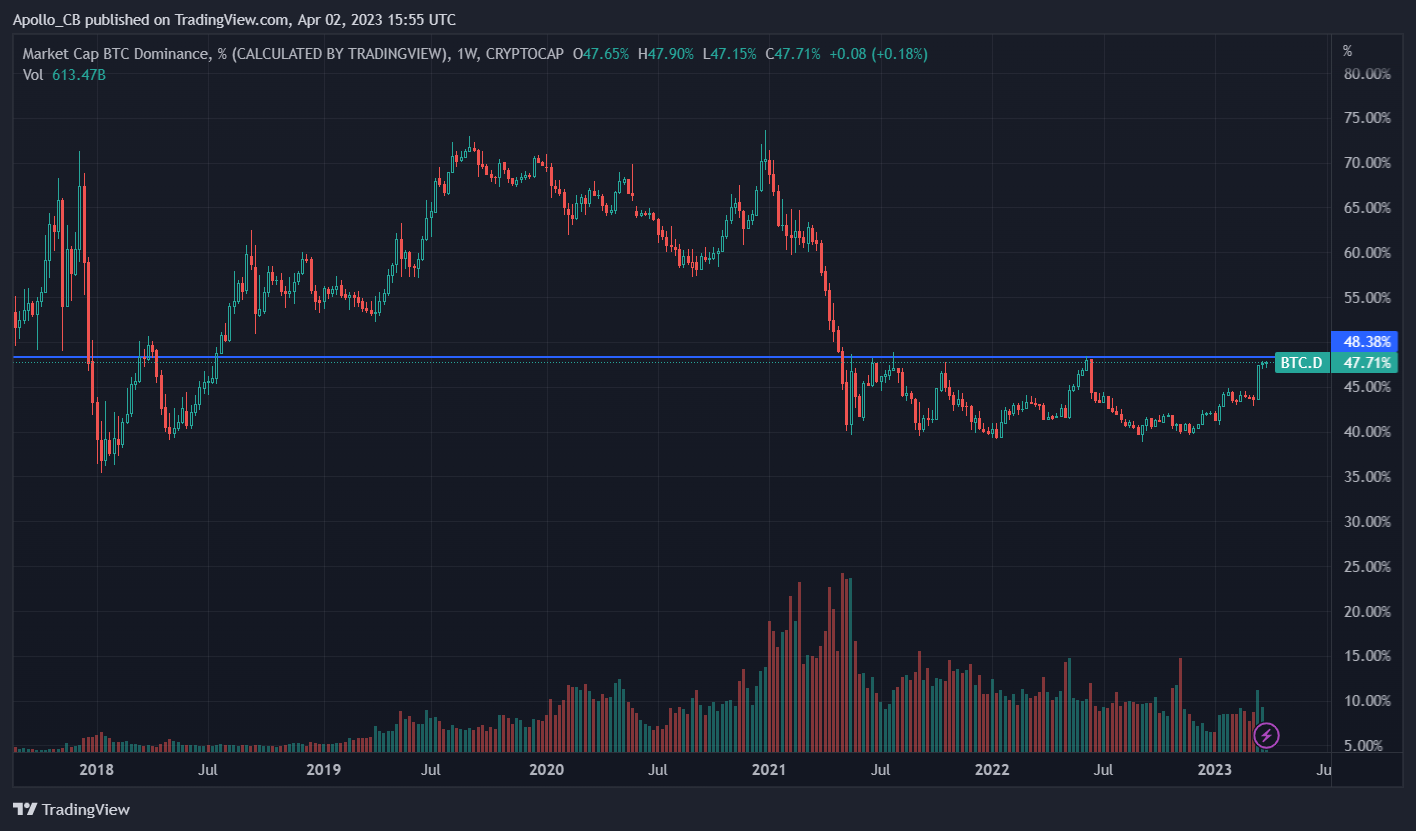
Alt coins are generally considered more speculative. As Bitcoin and Ethereum increase in price, the risk appetite of investors usually increases in tandem at the prospect of the trend continuing. A common outcome of this rising risk appetite is a volatile rise in alt coins. One method investors use to track this cycle that repeats itself so often in crypto is with the Bitcoin Dominance chart seen below.
How to use Bitcoin Dominance
When the total market cap of all crypto continues to rise, but the percentage weight of Bitcoin drops, this chart can be used to evaluate which area of the market will move next. If Ethereum’s share begins growing during an overall bull run, one can logically assume that the money will trickle down from Bitcoin. As money moves down to Ethereum, it will eventually find its way into other alternative coins.
This is a common, and well understood crypto phenomenon that experienced investors use to guide their next purchases. Since we aim to outperform Bitcoin with every play, and also outperform Ethereum (bold goal), this is a vital concept to understand when purchasing alt coins. For us at CoinBusters, we are always looking to diversify what we purchase and invest in. During growth cycles of the market, alt coins can turn into explosive profits. Although there is always an opportunity cost if you pick the wrong alts at the wrong time. The risk here lies when Bitcoin or Ethereum sees a down turn (even temporarily) – alt coins will drop just as quick (usually moreso) as they rise.
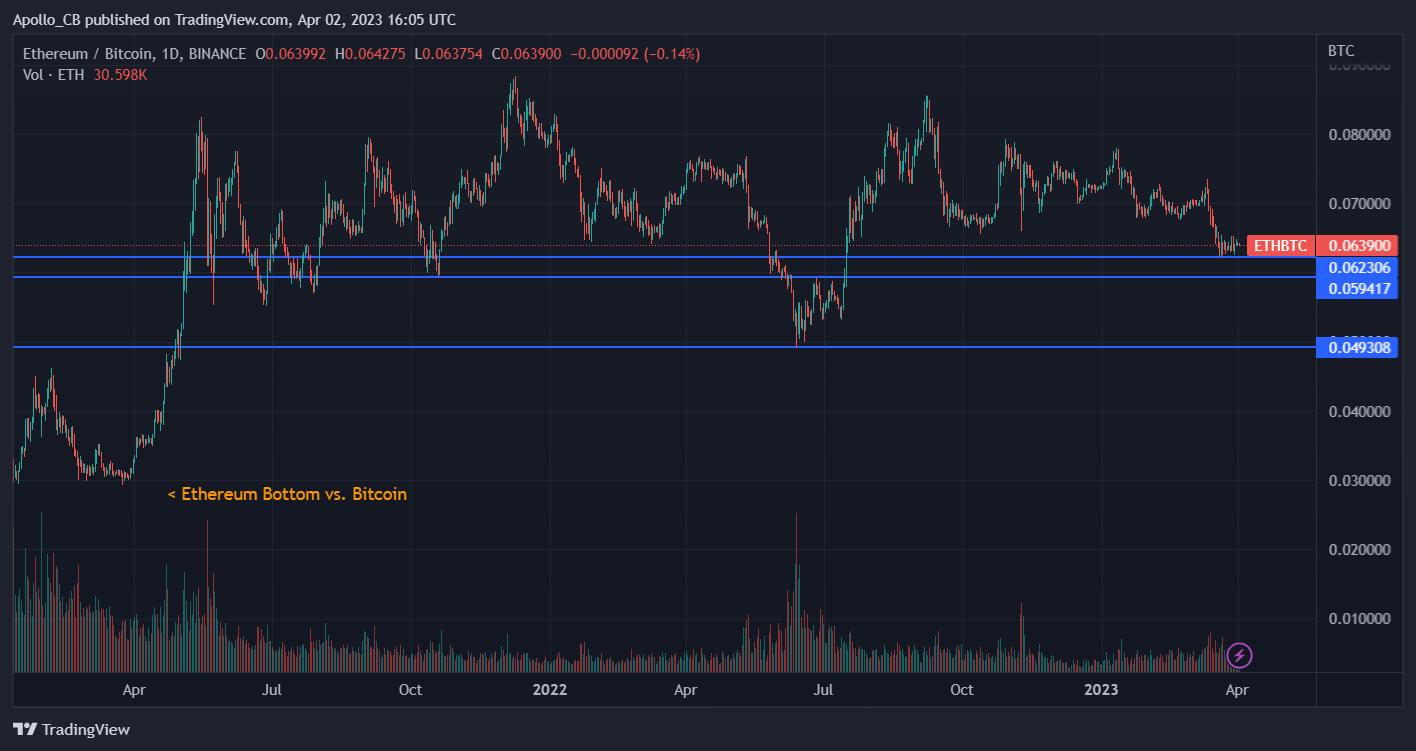
Many investors who have made money on Bitcoin hunger for greater rates of return, therefore they often turn to Ethereum. Most of the top 25 altcoins outperform Ethereum over time because their market caps are lower, which can sometimes mean they have more runway. The graph below helps express this theory with a visual, Ethereum has heavily outpaced Bitcoin since April 2021. While Bitcoin is considered the safest bet in crypto, other opportunities exist. Investing even a small percentage of the total crypto portfolio in some of the other assets mentioned below would greatly increase rates of return.
Bitcoin dominance must always be considered along side market cap. Without market cap in the picture, you will miss half of the puzzle. A key level that has been noted recently is 43.5% Bitcoin dominance. During a bull trend or market, Bitcoin falling to 43.5% indicates that investors are allocating into Ethereum and alt coins more heavily. This has been a key level for dollar cost averaging into the riskier lower cap coins that give the highest rates of return. Another key level I have noted personally in 2023, is 48% which is a massive area of historic resistance for the dominance chart.
I have a theory that the dominance will not explode the way that it used to due to fundamentally strong alts, large stablecoin market caps, and the increased adoption of Ethereum. Benjamin Cowen and some other well known analysts believe otherwise, so I would be happy to be proven wrong either direction. Here is a link to his site, he is usually very accurate for macro long-term moves [Cryptoverse]. I do believe dominance will go up but not over 55%.
Investors want to be in Bitcoin when the market cap increases, and Bitcoin dominance increases; and in alt coins when the market cap increases and Bitcoin dominance decreases. It is possible for bitcoin to move up or down and price and remain at the same percentage of dominance. It is also important to remember that market cap increases are not total inflows of money, but the market rate in reference to current supply and demand. Please remember none of this is financial advice. For another article on dominance during bear markets, check it out [here].


